Looking back on 2021
At the beginning of 2021, the first release of Kreya was published. Since then, many more releases have been added and more and more users are actively using Kreya. In this article, we give you an insight into our current telemetry data and briefly summarise the year 2021.
A look back - What was released
On 18 January 2021, the first Kreya release was published.
This was followed by 10 more releases until the end of 2021.
All details on the releases can be found on our release notes page.
Between releases, we publish alpha and beta versions of Kreya. There we came up with 61 alpha and 21 beta releases.
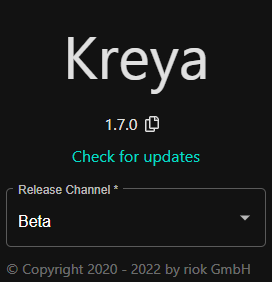
If you also want to use these versions, you can change the release channel to Alpha or Beta in the menu at the Kreya > About window.

Sometimes there are still bugs in these "unstable" versions or not everything works as it should, but you can help us to detect bugs early.
Insight into the telemetry data
We implemented the telemetry with Kreya version 1.4, which went live on 30 April. In an earlier blog post about the data in Q2, we already gathered some initial insights and showed you this with fancy charts. Since then, many more Kreya users have joined us, so here is an update of the most important numbers and charts.
| Measurement | Q2 | Q3 | Q4 | Total |
|---|---|---|---|---|
| Unique users (AppStarted) | 1,213 | 1,939 (+59.9%)* | 2,950 (+52.1%)* | 5,007 |
| Invoked operations | 58,910 | 161,120 (+173.5%)* | 272,385 (+69.1%)* | 492,415 |
*The percentage numbers refer to the change compared to the previous quarter.
Weekly active users
Weekly active users have steadily increased, to over 700 in December. The drop at the end of the chart is due to the Christmas holidays and should therefore not cause panic on the stock markets. 😉
Activity in detail
In the following table, all data on the activity of the users are given. In addition, the number of "Telemetry Disabled" events is also listed; we no longer receive telemetry data from these users.
| Measurement | Q2 | Q3 | Q4 | Total |
|---|---|---|---|---|
| Peak of daily active user | 100 | 166 (+66.0%)* | 241 (+45.2%)* | - |
| Peak of weekly active user | 298 | 492 (+65.1%)* | 702 (+42.7%)* | - |
| Peak of monthly active user | 801 | 1,065 (+33.0%)* | 1,517 (+42.4%)* | - |
| Telemetry disabled | 27 | 46 (+70.4%)* | 101 (+119.6%)* | 174 |
*The percentage numbers refer to the change compared to the previous quarter.
OS details
The three largest operating systems combined give the following numbers. What is striking is that Linux even saw a slight decline in active users in Q3. Windows and macOS are represented with fairly equal frequency and are also growing strongly together. The user numbers for Linux are stagnating in comparison.
| Measurement | Q2 | Q3 | Q4 | Total 2021 (Unique User) |
|---|---|---|---|---|
| Windows | 344 | 837 (+143.3%)* | 1,248 (+49.1%)* | 1935 |
| macOS | 342 | 700 (+104.7%)* | 1,208 (+72.6%)* | 1870 |
| Linux | 532 | 420 (-21.1%)* | 588 (+40.0%)* | 1323 |
*The percentage numbers refer to the change compared to the previous quarter.
Other numbers
In addition to the data shown above, there are other interesting data that can be used to draw conclusions about individual features.
The example project was opened 811 times at the start screen after a fresh installation. This is pleasing, as the feature has only been available since September. We also see that the directory settings are often used and are therefore a useful feature. The directory settings were updated 26,077 times. Other features that are often used: active environment changes (7,334 times) and import stream creations (5,377 times). But there are also features that are used less frequently: auth config creations (363 times) and certificate creations (292 times).
Among developers there are always discussions about "dark or light theme?". In November we introduced the light theme and since then we have registered 1159 theme changes. 664 changed to the right theme and 495 to the wrong one. All users who have not changed the theme use the default OS theme.
For the invoked operations, the requests were sent manually 1,059 times. This is only 0.2% of all invoked operations. There is also a huge difference between the different gRPC modes. Both, grpcWeb (1.6%) and grpcWebText (0.3%), are used rather rarely. By far the most used mode is the default gRPC mode (98.1%).
The median session length is 43.3 minutes. Fun fact, the average session length is 1.5 days, as somehow three users have managed to keep Kreya open for over 5 months.
Summary
We are very happy with the current situation with Kreya. Basically, you can say that our numbers are increasing by more than 50% every quarter. And we have already reached some milestones with over 5,000 users and almost half a million invoked operations.
Finally, we would like to thank all of you for using Kreya and for always providing us with suggestions for improvements via GitHub. Feel free to open a bug report or feature request if you notice something. You can also write to us at [email protected] if you have anything else you would like to tell us.
Stay tuned, we have a lot planned for 2022. 🚀